The economic impact of auto accidents in the United States, whether you are involved or not, was $340 billion, or $1,035 per person, in 2019, according to the most recent report from the National Transportation and Safety Administration in the United States. Highways (NHTSA)
For those who have been fortunate enough to drive without being in an accident, these reports might sound like something completely foreign, but the economic consequences of road accidents affect all drivers due to a long list of factors, which are not discovered but even after the accidents.
The main consequence for all drivers is the rising cost of auto insurance policies, which according to industry projections, will increase 8.4% in 2023, the highest increase since 2017.
But there are other costs associated with accidents that may surprise uninvolved motorists.
For example, government entities funded by taxpayer dollars are involved at almost every level of a car accident, and that costs you money whether you are involved or not.
“Public revenue paid for approximately 9% of all auto accident costs, costing taxpayers $30 billion in 2019, which is equivalent to $230 in additional taxes for every household in the United States,” the report from the agency said. NHTSA. “Alcohol-related accidents accounted for $69 billion or 20% of all economic costs. Alcohol was the cause of the crashes in approximately 82% of these cases, causing $57 billion in costs. Distracted driving accidents cost $98 billion.”
The total of the astronomical figure of all the accidents, again of $340 billion, represented 1.6% of the Gross Domestic Product (GDP) of the United States that year. That is everything that was produced in the country in 2019, and, according to the NHTSA estimate, the actual individual cost is more than $1.4 billion, when all the quality of life factors that are affected are included. after an accident like:
–Loss of market and household productivity: $106 billion
–Property damage: $115 billion dollars
–Medical expenses: $31 billion dollars
–Congestion caused by crashes (including travel delays, excessive fuel consumption, greenhouse gases and pollutants): $36 billion.
–Others: $51.4 million dollars.
Additionally, the NHTSA says that each of the 36,500 deaths recorded in 2019 represented $1.6 million in economic costs (or $11.3 million when quality of life assessments are considered).
Not everything is negative
The only good news from the report is that the total number of deaths that year was down significantly from the last time the analysis was done (2010).
“This is an encouraging trend, and it is even more impressive in light of increasing population and generally increasing travel rates over time,” the report said. “Some aspects of this decline are likely to continue and even accelerate as the older on-road fleet is replaced by newer vehicles with advanced safety features such as automatic emergency braking and other advanced crash avoidance systems.” .
According to the NHTSA the number of deaths fell to new lows in the years after the Great Recession, settling on a trend line of nearly 5,000 deaths below pre-recession levels, but because these data predate the pandemic, do not reflect the increase in deaths seen in late 2020, 2021 and early 2022.
“Initial indications are that the impacts of COVID were complex, reducing travel due to the economic shutdown, but allowing more speeding due to less traffic congestion (which may have contributed to more fatalities),” the NHTSA said. “These impacts may be temporary, but the long-term impact of COVID on work habits, specifically normalizing teleworking, may have more significant implications for traffic accidents in years to come.”
Other hidden costs of driving

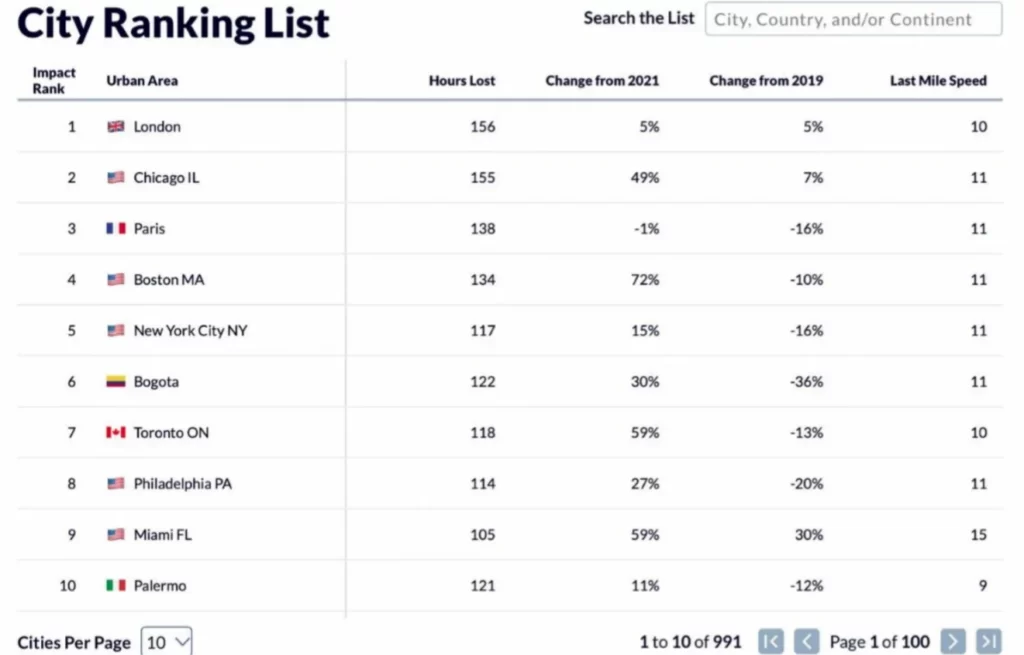
And even when there are no accidents, the average driver in the United States lost 51 hours of their time and $869 in 2022, simply due to traffic, which causes us to be late, miss job opportunities and simply burn gas without moving forward, according to the 2023 edition of the annual report of the Best and Worst Cities to Drive in America, from Wallethub.
The United States also has eight of the 25 worst cities in the world for traffic and 19 of the worst 25 in North America and 5 of the 10 worst traffic in the world.
And according to the World Economic Forum, the United States ranks 17th out of 141 countries when it comes to road quality, leading to more car breakdowns and a more frequent rate of need for maintenance. .
So the next time you’re about to take the wheel of your car, it might be worth doing the math first. You could lose more money than you may be going out to find.

