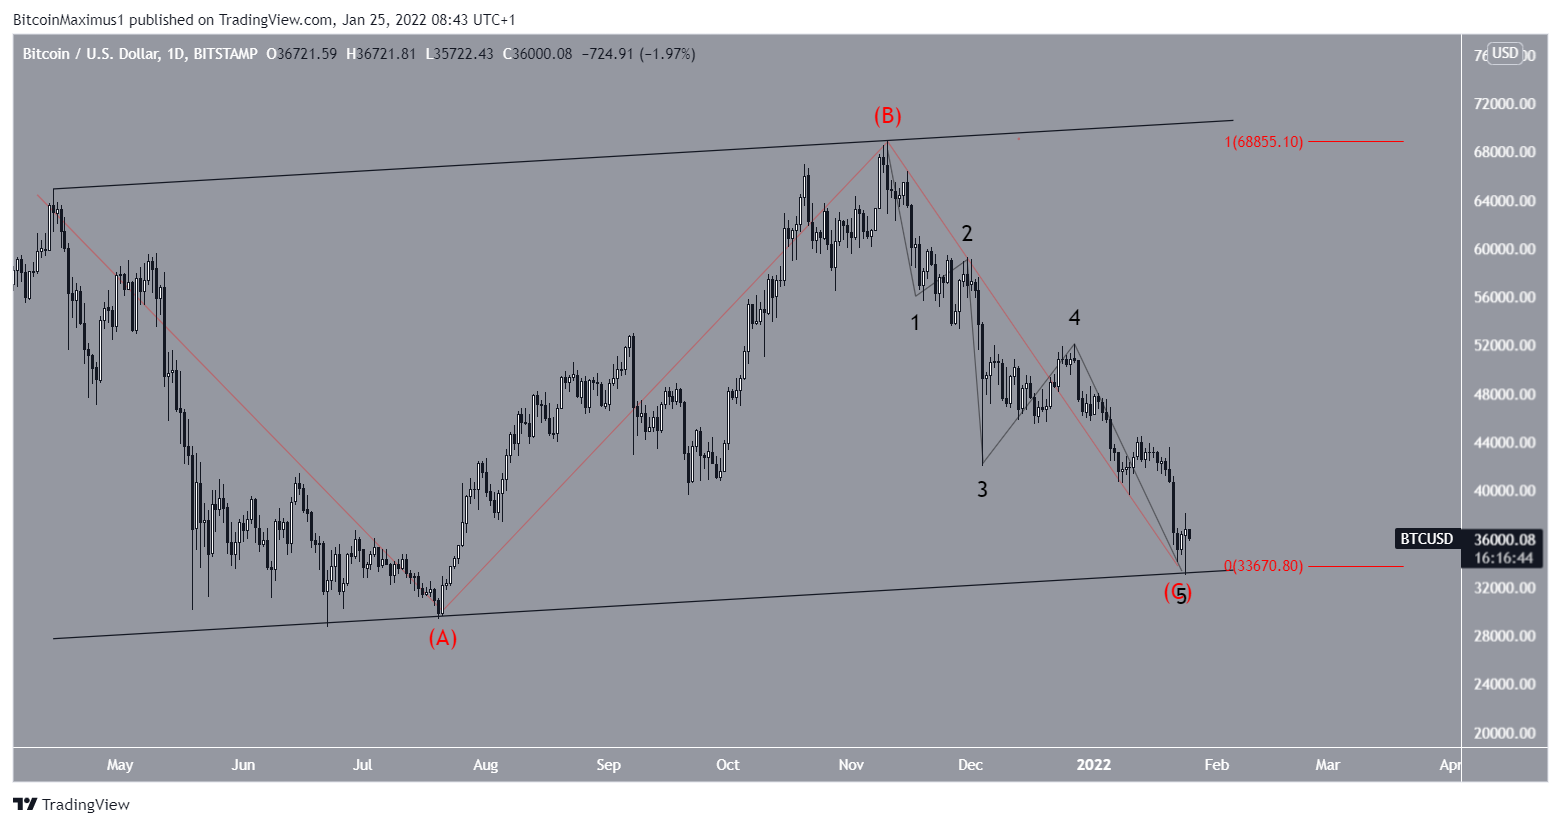
- Bitcoin trades inside an ascending parallel channel.
- It created a bullish candlestick on January 24.
- BTC has completed a corrective ABC structure.
Bitcoin (BTC) rallied sharply on Jan. 24 after falling to a long-term support level. Technical indicators are now showing signs that it may have completed its correction .
Bitcoin has been falling ever since it hit an all-time high on November 10, 2021 . The move lower eventually triggered a breakdown below the $40,800 horizontal support area, which is now expected to act as resistance.
The drop continued until January 25, when BTC hit a local low of $32,917. It bounced right after (green icon) and created a bullish candlestick with a very long lower wick. This is considered a sign of buying pressure.
In addition to this, the bounce validated a parallel ascending channel that has been in place since April 2021.

short term movement
The two-hour chart shows that the recent move higher was preceded by bullish divergences on both the RSI and the MACD . This is a development that often leads to bullish trend reversals.
After the bounce, BTC managed to reach a high of $37,550 before falling back.
Currently, it is trading just above the 0.382 Fibonacci retracement support level at $35,800. The next closest support levels are found at $35,260 and $34,700. These targets are the 0.5 and 0.618 Fib retracement support levels, respectively.
One of these levels is expected to give BTC another boost to the upside.
Bitcoin Wave Count
The wave count suggests that BTC has completed a corrective ABC structure that has been developing since April 2021. If correct, yesterday’s bounce was the final bottom, giving waves A:C a 1:1 ratio. The sub wave count is shown in black.
A closer look at subwave five reveals another five full waves down (red), further supporting this scenario.
While an alternate count suggests that another slight drop could eventually follow, it still predicts a bounce to test higher resistances.

